Median of Grouped Data Class 10: Formula & Examples
Quick answer: The median of grouped data is the value of the middle-most observation, found with
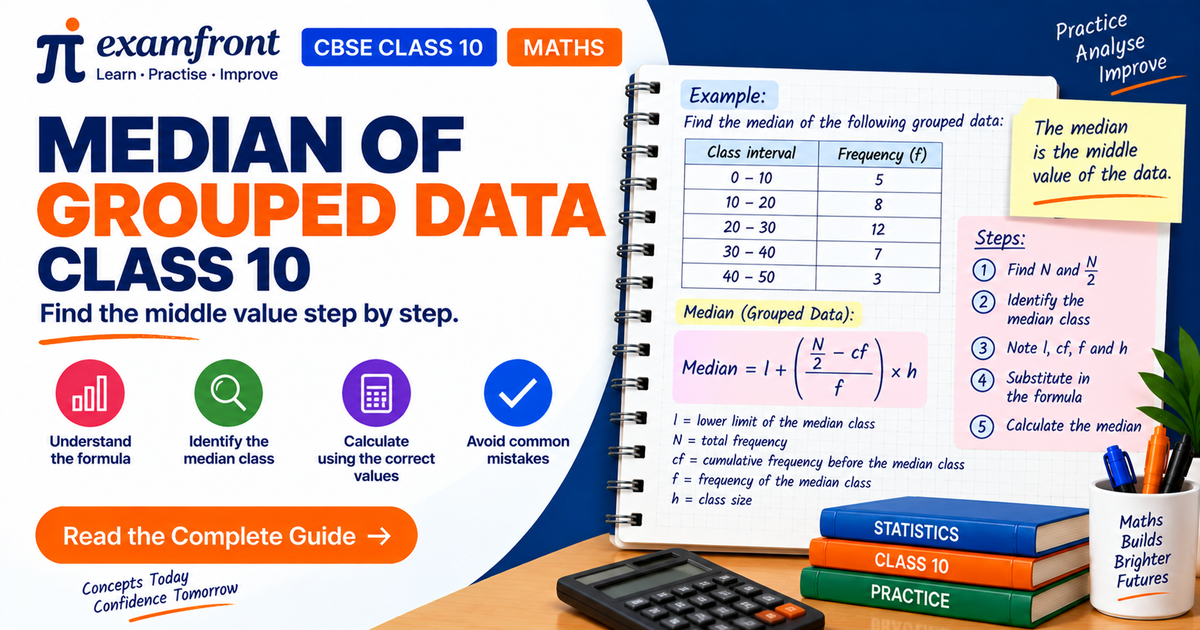
Median = l + ((n/2 − cf) / f) × h
where l = lower limit of the median class, n = total number of observations, cf = cumulative frequency of the class before the median class, f = frequency of the median class, and h = class size.
The median splits the data into two equal halves — half the values lie below it and half above. For grouped data you can’t just count to the middle, so you build a cumulative frequency column, find n/2, locate the median class, and apply the formula.
This guide defines cumulative frequency, shows how to find the median class, and works a full example that gives Median = 25.33, using the same data set as the mean and mode guides. At the end we connect all three with the empirical relationship.
What is the median, and why cumulative frequency?
The median is the middle value when data is arranged in order. For ungrouped data with n values: if n is odd, the median is the ((n+1)/2)ᵗʰ value; if n is even, it’s the average of the (n/2)ᵗʰ and ((n/2)+1)ᵗʰ values.
For grouped data the middle observation falls somewhere inside a class interval, so we need a way to see how the counts build up. That’s what cumulative frequency does.
Cumulative frequency (cf) of a class is the running total of frequencies up to and including that class — the number of observations below its upper limit.
Our data set (shared across the Statistics guides):
| Class interval | Frequency (f) | Cumulative frequency (cf) |
|---|---|---|
| 0–10 | 7 | 7 |
| 10–20 | 10 | 17 |
| 20–30 | 15 | 32 |
| 30–40 | 8 | 40 |
| 40–50 | 10 | 50 |
| Total | n = 50 |
Each cf is the previous cf plus the current frequency: 7, then 7+10 = 17, then 17+15 = 32, and so on.
examfront’s Topic Practice starts you on cumulative-frequency drills before the full median formula, so the foundation is solid before the harder problems arrive.
How to find the median class
The median class is the class that contains the middle observation. To find it:
- Build the cumulative frequency column — this comes first, always. Without it there is nothing to look down.
- Compute n/2. Here n = 50, so n/2 = 25.
- Read down the cf column and pick the first class whose cf is ≥ n/2.
The cumulative frequencies are 7, 17, 32, 40, 50. The first one that reaches or passes 25 is 32, which belongs to the class 20–30. So the median class is 20–30.
examfront’s Practice Companion checks your cumulative frequency column as you build it, so you never pick the wrong median class from a single addition slip.
🎬 Quick challenge: Can you spot the median class from the cumulative frequencies? 👀
The median formula, with every variable defined
Median = l + ((n/2 − cf) / f) × h
- Meaning in words: start at the lower limit of the median class, then move into it by the fraction of the class you still need to cross to reach the middle observation.
- Variables:
- l = lower limit of the median class
- n = total number of observations (Σf)
- cf = cumulative frequency of the class preceding the median class
- f = frequency of the median class
- h = class size
- Condition: class intervals must be continuous before applying the formula.
Worked example — finding the median step by step
Step 1 — Build the cf column and find n/2. Done above: n/2 = 25.
Step 2 — Identify the median class. First cf ≥ 25 is 32 → median class 20–30.
Step 3 — Read off the values.
- l = 20 (lower limit of 20–30)
- cf = 17 (cumulative frequency of 10–20, the class before)
- f = 15 (frequency of the median class)
- h = 10 (class size)
Step 4 — Substitute and simplify.
Median = 20 + ((25 − 17) / 15) × 10 = 20 + (8 / 15) × 10 = 20 + 5.33 = 25.33
So the median is 25.33: about half the observations are below 25.33 and about half are above it.
What if the data is “less than” type or has gaps?
Two common variations show up in exams:
- “Less than” / “more than” tables already give you cumulative frequencies. Convert them back to ordinary class frequencies (by subtracting consecutive cumulative values), then proceed as above.
- Discontinuous classes like 118–126, 127–135 must be made continuous first (117.5–126.5, 126.5–135.5, …) by adjusting each boundary by 0.5, because the formula assumes continuous classes.
The heavier versions — finding a missing frequency from a given median, or reading a median out of a “less than” table you have to convert first — build directly on these steps.
Those missing-frequency and table-conversion median problems are where marks are won or lost. Work the full graded set inside examfront and get personalised help exactly where your cumulative-frequency reasoning slips.
The empirical relationship (linking all three measures)
Once you have any two of the three measures, the third follows approximately from the empirical relationship:
3 Median = Mode + 2 Mean
Check it on our shared data, where mean = 25.8 and mode = 24.17:
3 × Median ≈ Mode + 2 × Mean = 24.17 + 2(25.8) = 75.77, so Median ≈ 75.77 / 3 ≈ 25.26 — very close to the calculated 25.33. The small gap is expected, because the relationship is empirical (approximate), not exact.
A key strength of the median: it is not affected by extreme values, because it depends only on the position of the middle observation. That’s why it’s the preferred “typical” value for skewed data like wages.
🎬 Quick challenge: Can you calculate the median using the correct n/2 value? 📊
Where this sits in the NCERT and CBSE syllabus
It is worth knowing exactly where this topic lives, because NCERT decides what you have to learn and CBSE decides how it will be asked.
NCERT sets the scope. The median of grouped data is Chapter 13, Statistics, of the NCERT Class 10 Maths textbook — Section 13.4, “Median of Grouped Data”, with Exercise 13.3 (7 questions). Note the numbering offset: the topic is Section 13.4 but the exercise is 13.3, because Section 13.1 is the chapter introduction and carries no exercise. The same offset exists in Chapter 3 and Chapter 9, and it is a common reason students practise the wrong exercise. Mean is §13.2 with Exercise 13.1, mode is §13.3 with Exercise 13.2, and median closes the chapter — the Statistics chapter guide covers all three together. The NCERT Class 10 Maths guide and the Class 10 Maths chapter list show where Statistics sits among the fourteen chapters.
One deletion matters here. The rationalised syllabus removed the cumulative frequency graph (ogive) and the “less than / more than” curves from this chapter. The CBSE scope for Statistics now reads, in full: “Mean, median and mode of grouped data (bimodal situation to be avoided).” So the cumulative frequency table is still central — it is how you find the median class — but you will not be asked to draw an ogive or read a median off the point where two curves cross. Older guide books and “important questions” PDFs still set those questions; the CBSE Class 10 Maths syllabus is the list to trust.
CBSE sets the shape. The board paper is 38 questions, 80 marks, three hours, with no overall choice, split across five sections: A 20 × 1, B 5 × 2, C 6 × 3, D 4 × 5, E 3 × 4 = 80. The full breakdown is in the CBSE Class 10 Maths exam pattern.
CBSE sets the priority by unit, not by chapter. The seven units carry Number Systems 6, Algebra 20, Coordinate Geometry 6, Geometry 15, Trigonometry 12, Mensuration 10, Statistics and Probability 11 = 80. Statistics shares those 11 marks with Probability, so the median is a dependable scorer rather than a huge one. Treat the chapter-wise percentage tables and pie charts you find online with suspicion — CBSE publishes marks per unit only, and chapter-level figures are unofficial estimates, as the unit-wise weightage guide explains.
How the median is actually asked. Almost always as a 3-mark Section C question, or as one part of a 5-mark or case-study question, phrased “find the median of the following distribution”. Two things follow. First, your cumulative frequency column is part of your answer, not rough work — it carries method marks even if the final arithmetic slips, so write it as a column in the table and never on a scrap of the margin. Second, the question will often hand you a “less than” table or a missing frequency instead of a clean distribution, so the study routine that builds that judgement matters as much as the formula.
Key Takeaways
- Median of grouped data: Median = l + ((n/2 − cf)/f) × h.
- Cumulative frequency = running total of frequencies; build this column first.
- Median class = first class whose cumulative frequency is ≥ n/2.
- Make class intervals continuous before applying the formula.
- Empirical relationship: 3 Median = Mode + 2 Mean (approximate); the median is not affected by extreme values.
- NCERT Chapter 13, Section 13.4, Exercise 13.3; Statistics and Probability is 11 of the 80 CBSE theory marks, and the ogive is no longer examinable.
Quick Facts
- Formula: Median = l + ((n/2 − cf)/f) × h.
- Use n/2 (not (n+1)/2) to locate the median class in grouped data.
- For our data, median class = 20–30, median = 25.33.
- cf in the formula is the cumulative frequency of the class before the median class.
- Empirical relationship: 3 Median = Mode + 2 Mean.
- NCERT reference: Chapter 13 §13.4, Exercise 13.3 (7 questions).
- The cumulative frequency table stays; the ogive (the graph) is out of the rationalised syllabus.
Common Mistakes
- Using (n+1)/2 instead of n/2 — for grouped data you locate the median class with n/2.
- Taking cf of the median class itself — cf must be the cumulative frequency of the preceding class.
- Not making classes continuous — 118–126 style classes must become 117.5–126.5 first.
- Forgetting to convert “less than” tables back to ordinary frequencies before finding f.
- Adding frequencies wrongly in the cf column — a single slip moves the median class and ruins the answer.
- Reaching for the formula before the cf column exists — you cannot identify a median class from a frequency table alone. Build the running totals first; that column is the step everything else stands on, and it is where the method marks are.
📄 Download: Median of Grouped Data Class 10 — 2-page summary PDF — the formula, the cumulative frequency method and a worked example on one printable sheet.
FAQ
What is the formula for the median of grouped data in Class 10? Median = l + ((n/2 − cf) / f) × h, where l is the lower limit of the median class, n the total observations, cf the cumulative frequency of the class before the median class, f the frequency of the median class, and h the class size.
What is cumulative frequency? The cumulative frequency of a class is the running total of frequencies up to and including that class — how many observations fall below its upper limit. It is essential for finding the median.
How do you find the median class? Compute n/2, then pick the first class whose cumulative frequency is ≥ n/2. That class is the median class.
What is the empirical relationship between mean, median and mode? The approximate relationship 3 Median = Mode + 2 Mean lets you estimate any one measure from the other two. With mean = 25.8 and mode = 24.17, Median ≈ (24.17 + 51.6)/3 ≈ 25.26.
Why is the median not affected by extreme values? Because it depends only on the position of the middle observation, not on the size of the largest or smallest values, so outliers don’t pull it up or down.
Is the median of grouped data part of the NCERT and CBSE Class 10 syllabus? Yes — NCERT Chapter 13, Statistics, Section 13.4, with Exercise 13.3 (7 questions). The CBSE scope reads “Mean, median and mode of grouped data (bimodal situation to be avoided)”, so the formula and the cumulative frequency table are examinable, while the cumulative frequency graph (ogive) was removed in the rationalisation. Statistics and Probability is Unit VII, worth 11 of the 80 theory marks.
Related Concepts
- Measures of central tendency — how the median compares with mean and mode.
- Mean of grouped data — the average and its three methods.
- Mode of grouped data — the most frequent value.
- Cumulative frequency tables — the running totals this whole method rests on. (The ogive, the graphical way of reading a median, was removed in the NCERT rationalisation.)
Ready to test yourself on median problems? Start with examfront’s Statistics quiz, and let Progress Tracking flag whether it’s the cumulative frequency or the formula that trips you up.