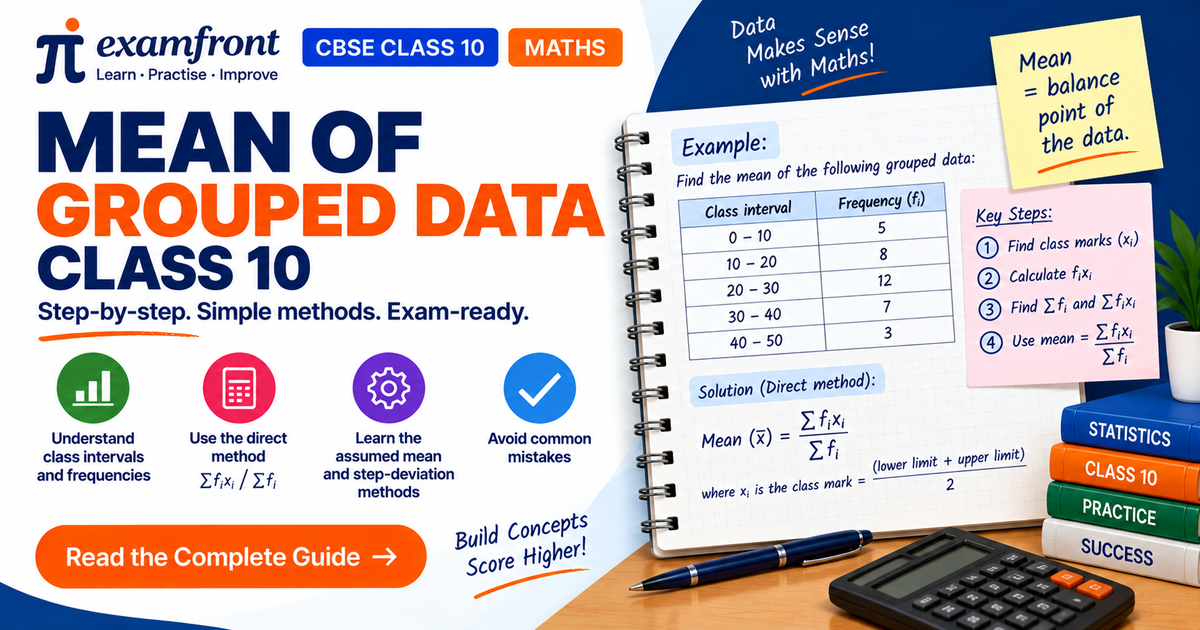
Mean of Grouped Data Class 10: Formula & 3 Methods
Quick answer: The mean of grouped data in Class 10 is found with
x̄ = Σfᵢxᵢ / Σfᵢ
where xᵢ is the class mark (mid-point) of each class, fᵢ is its frequency, and Σfᵢ = n is the total number of observations. You replace each class interval by its class mark, multiply by the frequency, add up, and divide by the total frequency.
There are three methods that all give the same mean: the direct method, the assumed-mean method and the step-deviation method. They are just shortcuts of one another — the direct method is the definition, while the other two reduce the arithmetic when the numbers are large.
To make this concrete, this guide uses one data set throughout, and all three methods land on the same answer, x̄ = 25.8. That’s the best way to see that the methods agree.
What is the mean of grouped data? (the class-mark idea)
For ungrouped data, the mean is simply the sum of values divided by how many there are. But grouped data gives you class intervals (like 0–10), not individual values — so which value represents a class?
The answer is the class mark, the mid-point of the interval:
Class mark = (Upper class limit + Lower class limit) ÷ 2
We assume every value in a class is centred at its class mark. So the class 0–10 is represented by 5, the class 10–20 by 15, and so on. These class marks become the xᵢ’s in the mean formula.
Our data set (used for all three methods):
| Class interval | Frequency (fᵢ) | Class mark (xᵢ) |
|---|---|---|
| 0–10 | 7 | 5 |
| 10–20 | 10 | 15 |
| 20–30 | 15 | 25 |
| 30–40 | 8 | 35 |
| 40–50 | 10 | 45 |
| Total | Σfᵢ = 50 |
Method 1 — The Direct Method
Formula: x̄ = Σfᵢxᵢ / Σfᵢ
- Meaning in words: multiply each class mark by its frequency, add all the products, and divide by the total frequency.
- Variables: xᵢ = class mark, fᵢ = frequency, Σfᵢ = n = total frequency.
- Condition: each class is assumed centred at its class mark; works for any grouped data.
Worked example (direct method).
| Class | fᵢ | xᵢ | fᵢxᵢ |
|---|---|---|---|
| 0–10 | 7 | 5 | 35 |
| 10–20 | 10 | 15 | 150 |
| 20–30 | 15 | 25 | 375 |
| 30–40 | 8 | 35 | 280 |
| 40–50 | 10 | 45 | 450 |
| Total | 50 | 1290 |
x̄ = Σfᵢxᵢ / Σfᵢ = 1290 / 50 = 25.8.
The direct method is perfect when the class marks and frequencies are small. When they get large, the next two methods save time.
examfront’s Practice Companion flags the moment your fᵢxᵢ column doesn’t add up, so a single arithmetic slip doesn’t quietly cost you the whole question.
🎬 Quick challenge: Can you find the mean using class marks and frequencies? 📊
Method 2 — The Assumed-Mean Method
When class marks are large, subtract a convenient value first. Choose an assumed mean ‘a’ (usually a central class mark) and find the deviation of each class mark from it:
dᵢ = xᵢ − a, then x̄ = a + Σfᵢdᵢ / Σfᵢ
- Meaning in words: shift every class mark by ‘a’ to get smaller numbers, average those shifts, then add ‘a’ back.
- Variables: a = assumed mean, dᵢ = xᵢ − a, fᵢ = frequency.
- Condition: works for any grouped data; most helpful when class marks are large.
Worked example (a = 25).
| Class | fᵢ | xᵢ | dᵢ = xᵢ − 25 | fᵢdᵢ |
|---|---|---|---|---|
| 0–10 | 7 | 5 | −20 | −140 |
| 10–20 | 10 | 15 | −10 | −100 |
| 20–30 | 15 | 25 | 0 | 0 |
| 30–40 | 8 | 35 | 10 | 80 |
| 40–50 | 10 | 45 | 20 | 200 |
| Total | 50 | 40 |
x̄ = a + Σfᵢdᵢ / Σfᵢ = 25 + 40/50 = 25 + 0.8 = 25.8 — the same answer as the direct method.
Once the idea clicks, examfront’s Chapter Quizzes let you lock it in with a timed mixed set before you move on to mode and median.
Method 3 — The Step-Deviation Method
If all deviations share a common factor (usually the class size h), divide by it to get even smaller numbers. Set:
uᵢ = (xᵢ − a) / h, then x̄ = a + h × (Σfᵢuᵢ / Σfᵢ)
- Meaning in words: take the assumed-mean shift, divide by the class size to get tiny whole numbers, average them, multiply back by h, and add ‘a’.
- Variables: a = assumed mean, h = class size, uᵢ = (xᵢ − a)/h.
- Condition: best when class sizes are equal and deviations have a common factor h.
Worked example (a = 25, h = 10).
| Class | fᵢ | xᵢ | uᵢ = (xᵢ − 25)/10 | fᵢuᵢ |
|---|---|---|---|---|
| 0–10 | 7 | 5 | −2 | −14 |
| 10–20 | 10 | 15 | −1 | −10 |
| 20–30 | 15 | 25 | 0 | 0 |
| 30–40 | 8 | 35 | 1 | 8 |
| 40–50 | 10 | 45 | 2 | 20 |
| Total | 50 | 4 |
x̄ = a + h × (Σfᵢuᵢ / Σfᵢ) = 25 + 10 × (4/50) = 25 + 0.8 = 25.8 — same answer again.
Which method should you choose?
- Direct method — best when xᵢ and fᵢ are small.
- Assumed-mean method — best when the class marks are large numbers.
- Step-deviation method — best when class sizes are equal and the deviations share a common factor (fastest of all).
A reassuring fact: the mean does not depend on your choice of ‘a’ or ‘h’. Any valid choice gives the same final answer, because the assumed-mean and step-deviation methods are simply rearranged versions of the direct method.
examfront’s Topic Practice lets you try the same question three ways, so you learn which method is fastest for each kind of data instead of always defaulting to one.
🎬 Quick challenge: Do all three methods give the same mean? 🤔
Where this sits in the NCERT and CBSE syllabus
It helps to know exactly where this topic lives, because NCERT decides what you have to learn and CBSE decides how it will be asked.
NCERT sets the scope. The mean of grouped data is Chapter 13, Statistics, of the NCERT Class 10 Maths textbook — Section 13.2, “Mean of Grouped Data”, with Examples 1 to 3 and Exercise 13.1 (9 questions). Note the numbering trap: the topic is Section 13.2 but the exercise is 13.1, because Section 13.1 is the chapter introduction and carries no exercise. The same offset exists in Chapter 3 and Chapter 9, and it is a common reason students practise the wrong exercise.
All three methods are in scope — direct, assumed-mean and step-deviation. This matters because “deleted syllabus” lists still circulating online drop the step-deviation method; those lists come from the temporary 2020-21 reduced syllabus and are out of date. What the rationalisation actually removed from this chapter is the cumulative frequency graph (ogive) and the “less than / more than” curves, so you will not be asked to draw one. The mean, median and mode of grouped data are all retained. If you want the full picture of what stayed and what went, the NCERT Class 10 Maths guide and the CBSE Class 10 Maths syllabus both map it chapter by chapter, and the Class 10 Maths chapter list shows where Statistics sits among the fourteen chapters.
CBSE sets the shape. The board paper is 38 questions, 80 marks, three hours, with no overall choice, split across five sections: A 20 × 1, B 5 × 2, C 6 × 3, D 4 × 5, E 3 × 4 = 80. The full breakdown is in the CBSE Class 10 Maths exam pattern.
CBSE sets the priority by unit, not by chapter. The seven units carry Number Systems 6, Algebra 20, Coordinate Geometry 6, Geometry 15, Trigonometry 12, Mensuration 10, Statistics and Probability 11 = 80. Statistics shares those 11 marks with Probability, so the mean is a dependable scorer rather than a huge one. Be careful with the chapter-wise percentage tables and pie charts you will find online — CBSE publishes marks per unit only, and chapter-level figures are unofficial estimates. The unit-wise weightage guide explains why.
How the mean is actually asked. Almost always as a 3-mark Section C question or as one part of a longer 5-mark or case-study question, phrased as “find the mean of the following distribution”. Two things follow from that. First, your table is part of your answer, not rough work — the fᵢxᵢ (or fᵢdᵢ, or fᵢuᵢ) column and the Σ row carry method marks even if the final division goes wrong. Second, the question rarely tells you which method to use, so choosing the quickest one is your decision and the study routine that builds that judgement is worth as much here as the formula itself.
Key Takeaways
- Mean of grouped data: x̄ = Σfᵢxᵢ / Σfᵢ, using each class’s class mark as xᵢ.
- Class mark = (upper limit + lower limit) ÷ 2 — always find these first.
- Three methods, one answer: direct, assumed-mean (x̄ = a + Σfᵢdᵢ/Σfᵢ) and step-deviation (x̄ = a + h·Σfᵢuᵢ/Σfᵢ) all gave 25.8.
- The mean does not depend on the choice of assumed mean ‘a’ or class size ‘h’.
- Pick the method that minimises arithmetic: step-deviation is fastest for equal class sizes.
- NCERT Chapter 13, Section 13.2, Exercise 13.1; Statistics and Probability is 11 of the 80 CBSE theory marks, and all three methods remain examinable.
Quick Facts
- Formula: x̄ = Σfᵢxᵢ / Σfᵢ.
- dᵢ = xᵢ − a (assumed-mean deviation); uᵢ = (xᵢ − a)/h (step deviation).
- Class mark of 0–10 is 5; of 20–30 is 25.
- All three methods give the same mean.
- The mean uses every observation, so extreme values affect it.
- NCERT reference: Chapter 13 §13.2, Examples 1–3, Exercise 13.1 (9 questions).
- The ogive / cumulative frequency graph is out of the rationalised syllabus; the step-deviation method is not.
Common Mistakes
- Using class limits instead of class marks in Σfᵢxᵢ — always convert each interval to its mid-point first.
- Sign errors in dᵢ or uᵢ — deviations below the assumed mean are negative; keep the signs when summing.
- Forgetting to multiply back by h in the step-deviation method — x̄ = a + h × (Σfᵢuᵢ/Σfᵢ), not a + Σfᵢuᵢ/Σfᵢ.
- Dividing by the number of classes instead of Σfᵢ — always divide by the total frequency n.
- Choosing an awkward ‘a’ — pick a central class mark so deviations stay small and symmetric.
- Writing only the final answer — the frequency table with its fᵢxᵢ column and Σ row is the working, and it carries the method marks. A bare “25.8” on the answer sheet throws most of a 3-mark question away.
📄 Download: Mean of Grouped Data Class 10 — 2-page summary PDF — the formula, all three methods and a worked example on one printable sheet.
FAQ
What is the formula for the mean of grouped data in Class 10? The mean of grouped data is x̄ = Σfᵢxᵢ / Σfᵢ, where xᵢ is the class mark of each class, fᵢ is its frequency and Σfᵢ is the total number of observations.
What are the three methods to find the mean of grouped data? The direct method (x̄ = Σfᵢxᵢ/Σfᵢ), the assumed-mean method (x̄ = a + Σfᵢdᵢ/Σfᵢ with dᵢ = xᵢ − a), and the step-deviation method (x̄ = a + h·Σfᵢuᵢ/Σfᵢ with uᵢ = (xᵢ − a)/h). All give the same mean.
What is the assumed mean method? You choose a convenient value ‘a’ (usually a central class mark), find deviations dᵢ = xᵢ − a, and use x̄ = a + Σfᵢdᵢ/Σfᵢ. It reduces arithmetic when class marks are large.
When should I use the step-deviation method? When the deviations share a common factor, usually the class size h. Set uᵢ = (xᵢ − a)/h and use x̄ = a + h·(Σfᵢuᵢ/Σfᵢ). It is fastest for equal class sizes.
Does the mean change if I choose a different assumed mean ‘a’? No. The mean does not depend on the choice of ‘a’ or ‘h’; every valid choice gives the same answer.
Is the mean of grouped data part of the NCERT and CBSE Class 10 syllabus? Yes — NCERT Chapter 13, Statistics, Section 13.2, with Examples 1 to 3 and Exercise 13.1 (9 questions). All three methods are examinable; the “deleted syllabus” lists that drop step-deviation date from the temporary 2020-21 reduction. What was actually removed is the cumulative frequency graph (ogive). Statistics and Probability is Unit VII, worth 11 of the 80 theory marks.
Related Concepts
- Measures of central tendency — how mean fits with median and mode.
- Mode of grouped data — the most frequent value.
- Median of grouped data — the middle value.
- Frequency distribution and class marks (Class 9) — the grouped-data basics used here.
The harder mean problems — missing frequency, combined means, changing class sizes — are exactly where marks slip. Work the full graded set inside examfront and let Mistake Identification pinpoint your slip before the board exam does.