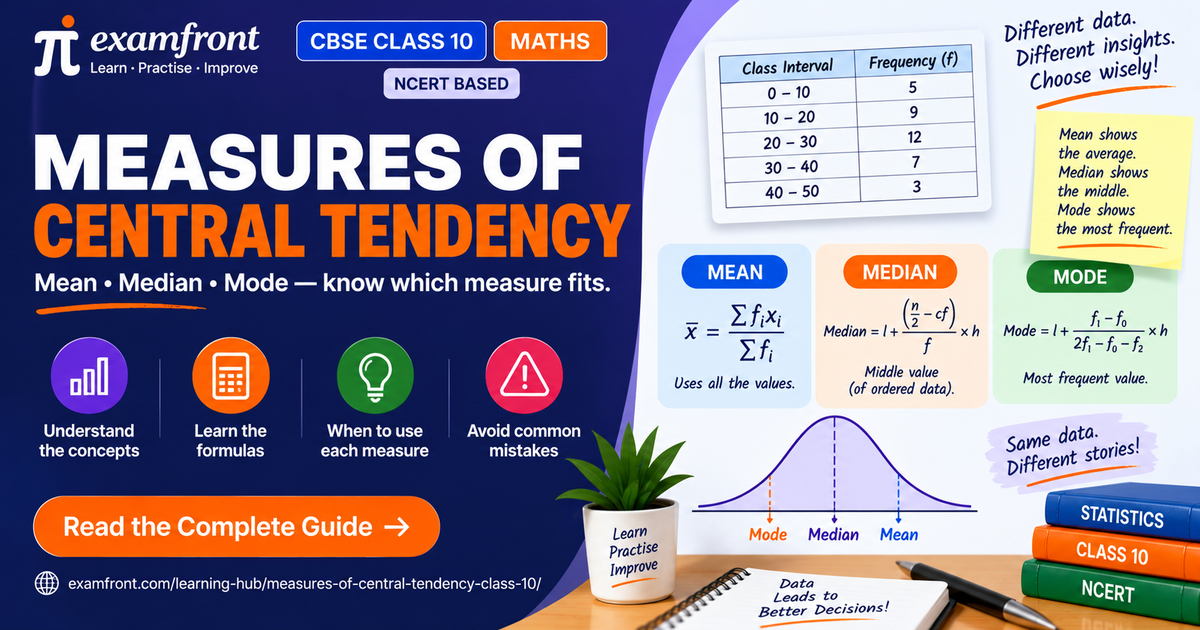
Measures of Central Tendency Class 10: Mean, Median, Mode
Quick answer: The measures of central tendency are single values that represent the “centre” of a data set. In Class 10 Statistics you study three of them — the mean (average), the median (middle value) and the mode (most frequent value) — and you extend all three from ungrouped data to grouped data (data arranged in class intervals).
For grouped data, each measure has its own formula: the mean is x̄ = Σfᵢxᵢ / Σfᵢ, the median is l + ((n/2 − cf)/f) × h, and the mode is l + ((f₁ − f₀)/(2f₁ − f₀ − f₂)) × h. Together they answer “what is a typical value in this data?” in three different, useful ways.
This guide gives you the big picture: what each measure means, how they compare, the class-mark idea that powers grouped-data calculations, and the handy empirical relationship 3 Median = Mode + 2 Mean. Each measure then has its own full walkthrough, linked below.
What is central tendency in statistics?
Central tendency is the tendency of data to cluster around a central value. A measure of central tendency is a single number that summarises the whole data set with one “representative” value — instead of listing hundreds of observations, you report one number that stands for them.
In Class 9 you found the mean, median and mode of ungrouped data (a plain list of values). In Class 10, real-life data is usually large, so it is condensed into grouped data — a frequency table with class intervals like 0–10, 10–20, 20–30. This chapter teaches you to find all three measures for such grouped data.
The three measures of central tendency at a glance
| Measure | What it tells you | Grouped-data formula |
|---|---|---|
| Mean (x̄) | The arithmetic average of all values | x̄ = Σfᵢxᵢ / Σfᵢ |
| Median | The middle-most value | l + ((n/2 − cf)/f) × h |
| Mode | The most frequent value | l + ((f₁ − f₀)/(2f₁ − f₀ − f₂)) × h |
Each row is a full topic in itself. This article orients you; the linked guides work each formula step by step with more examples.
examfront’s Chapter Quizzes mix mean, median and mode in a single set — the quickest way to check you can tell the three apart under exam pressure.
What is the mean of grouped data?
The mean (or average) is the sum of all observations divided by the number of observations. For grouped data:
x̄ = Σfᵢxᵢ / Σfᵢ
- Meaning in words: multiply each class’s representative value (its class mark) by how many values fall in that class, add these up, and divide by the total frequency.
- Variables: xᵢ = class mark of the iᵗʰ class, fᵢ = frequency of that class, Σfᵢ = n = total number of observations.
- Condition: we assume the frequency of each class is centred at its class mark (mid-point).
Worked example. For the data 0–10, 10–20, 20–30, 30–40, 40–50 with frequencies 7, 10, 15, 8, 10, the class marks are 5, 15, 25, 35, 45. Then Σfᵢxᵢ = 35 + 150 + 375 + 280 + 450 = 1290 and Σfᵢ = 50, so x̄ = 1290 / 50 = 25.8.
There are three methods to compute this — the direct method, the assumed-mean method and the step-deviation method — all giving the same answer. The full walkthrough is in the mean of grouped data guide.
Once you’ve seen the three methods, examfront’s Topic Practice lets you drill the one that suits each question so you pick the fastest route in the exam.
🎬 Quick challenge: Which measure represents the typical value with an extreme outlier?
What is a class mark, and why does it matter?
A class mark is the mid-point of a class interval:
Class mark = (Upper class limit + Lower class limit) ÷ 2
For the class 10–20, the class mark is (10 + 20)/2 = 15. Class marks turn each interval into a single representative value (xᵢ), which is exactly what the mean formula needs. Getting class marks right is the first step in almost every grouped-data question.
What is the median of grouped data?
The median is the value of the middle-most observation — it splits the data into two equal halves. For grouped data:
Median = l + ((n/2 − cf) / f) × h
- Variables: l = lower limit of the median class, n = total frequency, cf = cumulative frequency of the class before the median class, f = frequency of the median class, h = class size.
- Condition: class intervals must be continuous before applying the formula.
Worked example (same data). Cumulative frequencies are 7, 17, 32, 40, 50; n/2 = 25. The first class whose cumulative frequency crosses 25 is 20–30, so the median class is 20–30. Then Median = 20 + ((25 − 17)/15) × 10 = 20 + 5.33 = 25.33. The step-by-step method (including cumulative frequency) is in the median of grouped data guide.
What is the mode of grouped data?
The mode is the value that occurs most often. For grouped data, you first find the modal class (the class with the highest frequency), then apply:
Mode = l + ((f₁ − f₀) / (2f₁ − f₀ − f₂)) × h
- Variables: l = lower limit of the modal class, f₁ = frequency of the modal class, f₀ = frequency of the class before it, f₂ = frequency of the class after it, h = class size.
Worked example (same data). The modal class is 20–30 (frequency 15). Mode = 20 + ((15 − 10)/(2×15 − 10 − 8)) × 10 = 20 + (5/12) × 10 = 24.17. Full working is in the mode of grouped data guide.
Which measure of central tendency should you use?
Each measure suits a different situation:
- Mean — uses every observation and lies between the extremes, so it’s great for comparing distributions (e.g. comparing average marks of two schools). But extreme values distort it, so avoid it when the data has outliers.
- Median — gives a “typical” value and is not affected by extreme values, so it’s the better choice for skewed data like wages or productivity rates.
- Mode — best when you need the most frequent / most popular item, such as the most common shoe size sold or the most-watched TV programme.
Not sure which measure a question is really asking for? examfront’s Practice Companion nudges you toward the right one and explains why, so the choice starts to feel automatic.
The empirical relationship (a handy shortcut)
For a moderately skewed distribution, the three measures are connected by an empirical (approximate) relationship:
3 Median = Mode + 2 Mean
This lets you estimate any one measure from the other two. Check it on our data: 3 × 25.33 = 76.0, and Mode + 2 Mean = 24.17 + 2(25.8) = 75.77 — very close, exactly as “empirical” (approximate) suggests.
Notice what the relationship implies about the picture. When a distribution is symmetric, the three measures collapse onto a single point: mean = median = mode, all at the peak. They pull apart only when the data is skewed, and then they line up in a fixed order — the mode sits at the peak, the median next, and the mean furthest along the longer tail.
A quick note on cumulative frequency and ogives
Cumulative frequency of a class is the running total of frequencies up to and including that class. It is the key to finding the median, and it is also what an ogive — a “less than” or “more than” cumulative frequency curve — is drawn from. Cumulative frequency is explained fully in the median guide, where you actually use it.
One scope note worth having: drawing the ogive was removed in the NCERT rationalisation, so no board question will ask you to plot a cumulative frequency curve or to read the median off one. Cumulative frequency itself stays, because the median formula cannot be applied without it. Know the running total; you do not need the graph paper.
🎬 Quick challenge: Can you spot the class mark in just 5 seconds? ⏱️
Where this sits in the NCERT and CBSE syllabus
NCERT sets the scope. Class 10 Maths is 7 units and 14 chapters — Constructions was dropped in the rationalisation — and you can see the whole map in the chapter list and the NCERT Class 10 Maths guide. All three measures live in Chapter 13, Statistics, alongside the rest of the Statistics chapter. Watch the numbering: the mean is taught in Section 13.2, but its exercise is Exercise 13.1 (9 questions), because §13.1 is only the introduction and carries no exercise of its own. Chapters 3 and 9 have exactly the same offset, so treat it as this textbook’s habit rather than a misprint. The median and the mode follow in their own exercises.
The CBSE scope for this chapter reads: “Mean of grouped data — direct, assumed mean, and step-deviation methods; median of grouped data; mode of grouped data; relationship between mean, median, and mode.” Two things follow from that sentence. All three methods for the mean are still examinable — the widely copied “deleted syllabus” lists that call the step-deviation method removed are quoting the temporary 2020-21 reduced syllabus, not the current one. And the ogive really is gone, which is why the previous section says to learn cumulative frequency without the graph. If you are working from an old textbook or a downloaded PDF, check it against how to study NCERT Maths before you spend an evening on something that cannot be asked.
CBSE sets the shape. The theory paper is 38 questions, 80 marks, three hours, with no overall choice: Section A 20 × 1, Section B 5 × 2, Section C 6 × 3, Section D 4 × 5 and Section E 3 × 4 = 80. Theory 80 plus internal assessment 20 makes 100. The full breakdown is in the exam pattern guide and the syllabus.
CBSE sets priority by unit, not by chapter. The seven units carry Algebra 20, Geometry 15, Trigonometry 12, Statistics and Probability 11, Mensuration 10, Number Systems 6 and Coordinate Geometry 6, totalling 80. That 11 is shared between Statistics and Probability — CBSE publishes no separate mark value for this chapter, and the chapter-wise percentage tables and pie charts circulating online are unofficial estimates, not a blueprint. The official position is set out in the unit-wise weightage guide.
How these three are actually asked. Finding the mean, median or mode of a grouped distribution is typically a 3-mark Section C question, or one part of a 5-mark Section D question or a 4-mark case study. Your frequency table — the extra columns for class marks, fᵢxᵢ or cumulative frequency — is part of the answer, not rough work, so draw it properly. “Which measure of central tendency is appropriate here?” turns up as a 1-mark objective, and the empirical relationship is a favourite way to ask for a third value when two are given. One last warning about diagrams: because mean, median and mode coincide on a symmetric curve, any picture that marks the three at different points on a symmetrical bell shape is not describing that data. If the three are drawn apart, the curve should be visibly skewed and the mode should sit at the peak.
Key Takeaways
- Central tendency = a single value that represents the centre of a data set; Class 10 studies mean, median and mode for grouped data.
- Mean = Σfᵢxᵢ / Σfᵢ (average), Median = l + ((n/2 − cf)/f) × h (middle value), Mode = l + ((f₁ − f₀)/(2f₁ − f₀ − f₂)) × h (most frequent).
- A class mark = (upper + lower limit)/2 represents each class in mean calculations.
- Use the mean for a balanced average, the median when outliers are present, and the mode for the most common value.
- Empirical relationship: 3 Median = Mode + 2 Mean (approximate).
- All three are NCERT Chapter 13 — the mean in Section 13.2 with Exercise 13.1 — and all three methods for the mean remain examinable, but drawing the ogive does not.
Quick Facts
- There are three measures of central tendency in Class 10: mean, median, mode.
- Class mark = (upper class limit + lower class limit) ÷ 2.
- The mean is affected by extreme values; the median is not.
- Empirical relationship: 3 Median = Mode + 2 Mean.
- Class intervals must be continuous before applying the median and mode formulas.
- On a symmetric distribution mean = median = mode; they separate only when the data is skewed.
- Statistics and Probability carry 11 of the 80 theory marks, shared between the two chapters.
Common Mistakes
- Confusing which measure is which — mean = average, median = middle, mode = most frequent. Mixing them up costs easy marks.
- Using raw class limits instead of class marks in the mean formula — always convert each class to its mid-point first.
- Forgetting to make classes continuous before finding median or mode (e.g. 118–126 must become 117.5–126.5).
- Applying the mean when the data has extreme values — the median is usually the better “typical” value there.
- Treating the empirical relationship as exact — 3 Median = Mode + 2 Mean is an approximation, not an equality.
- Assuming the three always sit at different points — on a symmetric distribution they coincide at the peak. Separate positions mean skewed data, in the order mode, median, mean towards the longer tail.
📄 Download the 2-page Measures of Central Tendency summary (PDF) — all three formulas, a data set worked to all three answers, and the symmetric-versus-skewed picture, on two printable pages.
FAQ
What are the three measures of central tendency in Class 10? They are the mean (average of all values), the median (middle value when data is ordered) and the mode (most frequent value). For grouped data they use x̄ = Σfᵢxᵢ / Σfᵢ, l + ((n/2 − cf)/f) × h, and l + ((f₁ − f₀)/(2f₁ − f₀ − f₂)) × h respectively.
What is the difference between mean, median and mode? The mean is the arithmetic average and uses every value, so extreme values affect it. The median is the middle-most value and is not affected by extreme values. The mode is the most frequently occurring value, best for the most popular or common item.
What is a class mark in statistics Class 10? A class mark is the mid-point of a class interval: class mark = (upper class limit + lower class limit) ÷ 2. For 10–20 it is 15. Class marks represent each class when finding the mean of grouped data.
What is the empirical relationship between mean, median and mode? The empirical (approximate) relationship is 3 Median = Mode + 2 Mean. If mean = 25.8 and median = 25.33, then Mode ≈ 3(25.33) − 2(25.8) = 24.17.
Which measure of central tendency is best for grouped data? It depends: use the mean when every value matters and there are no outliers, the median for a typical value when extreme values are present, and the mode for the most frequent or popular value.
Are mean, median and mode part of the NCERT and CBSE Class 10 Maths syllabus? Yes. All three are NCERT Chapter 13, Statistics. The mean is taught in Section 13.2 and drilled in Exercise 13.1 (9 questions), and the median and mode follow in their own exercises. The CBSE scope covers the mean by the direct, assumed mean and step-deviation methods, the median and mode of grouped data, and the relationship between the three. Drawing the cumulative frequency graph (ogive) was removed in the rationalisation, though cumulative frequency itself stays because the median needs it. Statistics and Probability together carry 11 of the 80 theory marks.
Related Concepts
- Mean of grouped data — direct, assumed-mean and step-deviation methods.
- Mode of grouped data — modal class and the mode formula.
- Median of grouped data — cumulative frequency and the median formula.
- Frequency distribution and class intervals (Class 9) — the grouped-data foundation this chapter builds on.
Ready to master all three measures? Practise mixed mean–median–mode questions on examfront, and let Progress Tracking show you which measure you still confuse so you can fix it before the board exam.