Mode of Grouped Data Class 10: Formula & Examples
Quick answer: The mode of grouped data is the value that occurs most often, and it is found with
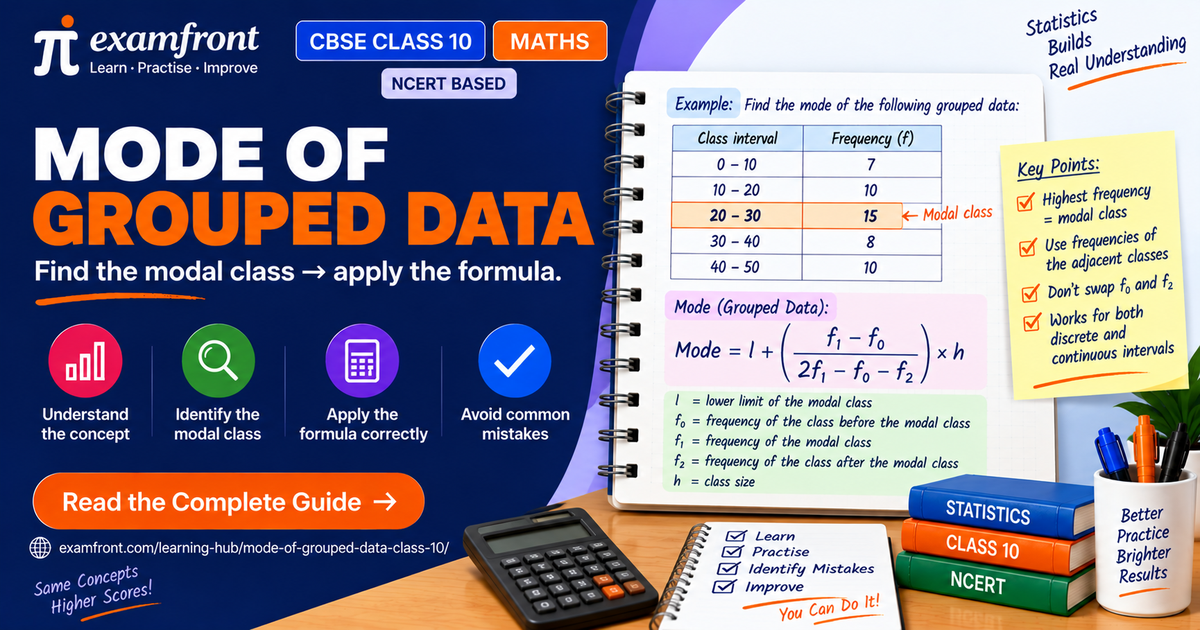
Mode = l + ((f₁ − f₀) / (2f₁ − f₀ − f₂)) × h
where l = lower limit of the modal class, f₁ = frequency of the modal class, f₀ = frequency of the class before it, f₂ = frequency of the class after it, and h = class size.
Unlike ungrouped data — where you just pick the most repeated value — grouped data hides individual values inside intervals. So you can’t read the mode off directly. Instead you first find the modal class (the interval with the highest frequency), then use the formula to pin down a value inside that class.
In this guide we identify the modal class, define every symbol, and work a full example that gives Mode = 24.17, using the same data set as the mean and median guides so you can compare all three.
What is the mode, and what is the modal class?
The mode is the observation with the maximum frequency — the value that appears most often. For ungrouped data it’s obvious: in 2, 6, 4, 5, 0, 2, 1, 3, 2, 3, the number 2 appears three times, so the mode is 2.
For grouped data you can only locate a class with the maximum frequency, called the modal class. The mode is then a specific value inside that class, calculated with the formula. (We restrict ourselves to data with a single mode; data with two or more equal maximum frequencies is called multimodal and is out of scope here — the CBSE syllabus says so in as many words, and the next-but-one section quotes it.)
Our data set (shared across the Statistics guides):
| Class interval | Frequency |
|---|---|
| 0–10 | 7 |
| 10–20 | 10 |
| 20–30 | 15 ← highest |
| 30–40 | 8 |
| 40–50 | 10 |
The highest frequency is 15, so the modal class is 20–30.
The mode formula, with every variable defined
Mode = l + ((f₁ − f₀) / (2f₁ − f₀ − f₂)) × h
- Meaning in words: start at the lower limit of the modal class, then move into it by an amount that depends on how much taller the modal class is than its neighbours.
- Variables:
- l = lower limit of the modal class
- f₁ = frequency of the modal class
- f₀ = frequency of the class preceding the modal class
- f₂ = frequency of the class succeeding the modal class
- h = size of the class interval
- Condition: class intervals must be continuous and (for this formula) of equal size.
What if the class intervals are not continuous?
That last condition is not a formality, and it is the one step students skip. The formula reads l and h off the class boundaries, so if the classes have gaps between them, both numbers are wrong before you start.
Classes written 1–3, 4–6, 7–9, 10–12 have gaps: nothing sits between 3 and 4. These are inclusive (discontinuous) classes, and the formula cannot be applied to them as they stand. Convert first by taking half the gap — here the gap is 1, so half of it is 0.5 — and shifting every boundary:
| As written | Continuous form |
|---|---|
| 1–3 | 0.5–3.5 |
| 4–6 | 3.5–6.5 |
| 7–9 | 6.5–9.5 |
| 10–12 | 9.5–12.5 |
Why it matters, in numbers. Take frequencies 5, 9, 12, 4 on those classes. The modal class is the third one, with f₁ = 12, f₀ = 9, f₂ = 4 and h = 3.
- Straight off the written classes, l = 7 and Mode = 7 + (3/11) × 3 = 7.82 — wrong.
- After conversion, l = 6.5 and Mode = 6.5 + (3/11) × 3 = 7.32 — correct.
The answer is out by exactly 0.5, the half-gap you failed to subtract. So the rule is short: if there is a gap between one class and the next, make the classes continuous before you write anything else down. A data set that is already continuous, like our 0–10, 10–20, 20–30 table, needs no conversion.
examfront’s Mistake Identification flags a missing continuity conversion the moment it changes your answer, which is the only way most students find out they have been doing it wrong.
Worked example — finding the mode step by step
Step 1 — Identify the modal class. The maximum frequency is 15, so the modal class is 20–30.
Step 2 — Read off the values.
- l = 20 (lower limit of 20–30)
- f₁ = 15 (modal class frequency)
- f₀ = 10 (frequency of 10–20, the class before)
- f₂ = 8 (frequency of 30–40, the class after)
- h = 10 (class size)
Step 3 — Substitute and simplify.
Mode = 20 + ((15 − 10) / (2×15 − 10 − 8)) × 10 = 20 + (5 / (30 − 18)) × 10 = 20 + (5 / 12) × 10 = 20 + 4.17 = 24.17
So the mode of this data is 24.17 — the value that best represents the “most common” region of the distribution.
examfront’s Topic Practice throws you distributions where the modal class isn’t the obvious middle one — the fastest way to stop mis-reading f₀ and f₂.
🎬 Quick challenge: Can you spot the modal class from the frequency table? 📊
A second quick example (smaller numbers)
Suppose family sizes are grouped as 1–3, 3–5, 5–7, 7–9 with frequencies 5, 9, 12, 4. These classes are already continuous — 3 ends one and starts the next — so no conversion is needed. The maximum frequency is 12, so the modal class is 5–7.
- l = 5, f₁ = 12, f₀ = 9, f₂ = 4, h = 2
Mode = 5 + ((12 − 9) / (2×12 − 9 − 4)) × 2 = 5 + (3 / 11) × 2 = 5 + 0.55 = 5.55.
So the most common family size is about 5.55 members — read as “between 5 and 6, closer to 5 or 6 depending on the neighbours.”
examfront’s Chapter Quizzes pair mode questions with mean and median ones, so you practise choosing the right formula, not just plugging into a known one.
Mode vs. mean vs. median — when to use the mode
The mode answers a different question from the mean and median. Use the mode when you need the most frequent or most popular value, such as:
- the most common shoe size a shop sells,
- the most-watched TV programme,
- the consumer item in greatest demand,
- the colour of car most people own.
For our shared data, mode = 24.17, while the mean is 25.8 and the median is 25.33. All three describe the “centre,” but each in its own way — which is exactly why Class 10 teaches all three.
examfront’s Mistake Identification catches the classic mode slip — swapping f₀ and f₂ — the moment it happens, so it doesn’t become a habit.
🎬 Quick challenge: Can you calculate the mode using the grouped-data formula? 📊
Where this sits in the NCERT and CBSE syllabus
NCERT sets the scope. The mode of grouped data is Chapter 13, Statistics, Section 13.3, “Mode of Grouped Data”, taught through Examples 4, 5 and 6 and drilled in Exercise 13.2, which has 6 questions. Note the numbering trap: the topic is Section 13.3 but Exercise 13.2, because Section 13.1 is the introduction and carries no exercise of its own. The same one-step offset appears in Chapters 3 and 9, so treat it as this textbook’s habit rather than a misprint. The chapter maps cleanly once you know it:
| Section | Topic | Exercise | Questions |
|---|---|---|---|
| 13.2 | Mean of grouped data | 13.1 | 9 |
| 13.3 | Mode of grouped data | 13.2 | 6 |
| 13.4 | Median of grouped data | 13.3 | 7 |
One deletion matters here: the cumulative frequency graph (ogive) was removed in the rationalisation, and the old fourth exercise went with it. Solution sites that still list an “Exercise 13.4” are reproducing a pre-rationalisation edition — check your textbook, not an aggregator. Cumulative frequency itself stays, because the median of grouped data needs it. If you want the whole chapter in order, the statistics chapter guide sets it out, and the full chapter list shows where Chapter 13 sits among the fourteen.
The CBSE scope line does the mode a favour. Quoted in full, Statistics reads: “Mean, median and mode of grouped data (bimodal situation to be avoided).” That parenthesis is a promise you can rely on in the exam — a board question will always give you one clear highest frequency. If you find two classes tied at the top, you have almost certainly misread a frequency or copied the table wrong, and the fastest fix is to re-add the column rather than invent a method for it. Working through the NCERT Class 10 Maths guide and how to study NCERT Maths is the cheapest way to make that scope line stick.
CBSE sets the shape of the paper. The theory paper is 80 marks over 38 questions in three hours, with no overall choice, plus 20 marks of internal assessment for 100 in total. The five sections are A 20×1, B 5×2, C 6×3, D 4×5 and E 3×4 = 80. Full detail is on the exam pattern page and the syllabus overview.
CBSE sets priority by unit, not by chapter. The seven units carry 6, 20, 6, 15, 12, 10 and 11 marks = 80, and Statistics shares its 11 marks with Probability. There is no official mark value for the Statistics chapter on its own — the chapter-wise percentage tables and pie charts circulating online are unofficial estimates, and the unit-wise weightage guide explains why.
How the mode is actually asked. Usually as a 3-mark question in Section C, or as one part of a 5-marker or a case study that also wants the mean or the median from the same table. Three things are worth knowing before you sit down. Naming the modal class is itself a mark — write “modal class = 20–30 (highest frequency 15)” as a line, don’t just start substituting. The stem often hands you an inclusive distribution (1–3, 4–6 style) precisely to see whether you convert it; that conversion is a mark too. And a common variation gives you the mode and asks for a missing frequency, which turns the formula into a one-unknown equation rather than a substitution.
Key Takeaways
- Mode of grouped data: Mode = l + ((f₁ − f₀)/(2f₁ − f₀ − f₂)) × h.
- The modal class is the interval with the highest frequency — find it first.
- f₀ is the frequency before the modal class and f₂ is the frequency after it — don’t swap them.
- Class intervals must be continuous and equal in size before applying the formula — a gap of 1 left unconverted shifts your answer by 0.5.
- Use the mode when the “most frequent / most popular” value is what you need.
- NCERT §13.3, Exercise 13.2 (6 questions); CBSE promises a single modal class, so a tie means you have misread the table.
Quick Facts
- Formula: Mode = l + ((f₁ − f₀)/(2f₁ − f₀ − f₂)) × h.
- Modal class = class with the maximum frequency.
- For our data, modal class = 20–30, mode = 24.17.
- The mode can be less than, equal to, or more than the mean.
- Data with two or more equal top frequencies is called multimodal (out of Class 10 scope).
- NCERT reference: Chapter 13, Section 13.3, Examples 4–6, Exercise 13.2 (6 questions).
- CBSE scope, verbatim: “Mean, median and mode of grouped data (bimodal situation to be avoided).” Unit VII = 11 of 80.
Common Mistakes
- Picking the class with the highest class mark instead of the highest frequency — the modal class is about frequency, not the size of the interval.
- Swapping f₀ and f₂ — f₀ is the class before the modal class, f₂ the class after.
- Forgetting to make classes continuous — 1–3, 4–6 style classes have gaps, so l and h are both wrong until you convert them. On a gap of 1 the answer comes out exactly 0.5 too high (7.82 instead of 7.32 in the example above), and the arithmetic looks perfectly clean while it happens.
- Miscomputing the denominator — it is 2f₁ − f₀ − f₂, a common spot for sign slips.
- Confusing mode with mean — mode = most frequent value, mean = average; they are usually different numbers.
- Starting to substitute without naming the modal class — the line “modal class = 20–30” is a mark in Section C, and skipping it also makes f₀ and f₂ far easier to swap.
📄 Download the Mode of Grouped Data summary (PDF) — the formula, the variable decoder and two worked examples on two pages.
FAQ
What is the formula for the mode of grouped data in Class 10? Mode = l + ((f₁ − f₀) / (2f₁ − f₀ − f₂)) × h, where l is the lower limit of the modal class, f₁ its frequency, f₀ the frequency of the class before it, f₂ the frequency of the class after it, and h the class size.
What is the modal class? The modal class is the class interval with the highest frequency. You locate it first, then apply the mode formula to find a value inside it.
How do you find the mode of grouped data step by step? Identify the modal class (maximum frequency), read off l, f₁, f₀, f₂ and h, then substitute into Mode = l + ((f₁ − f₀)/(2f₁ − f₀ − f₂)) × h and simplify.
What is the difference between mode and mean? The mode is the most frequent value (best for the most popular item); the mean is the arithmetic average of all values (affected by extremes). For our data, mode = 24.17 and mean = 25.8.
When is the mode the best measure of central tendency? When you need the most frequent or most popular value — such as the most common shoe size, most-watched programme, or item in greatest demand.
Is the mode of grouped data part of the NCERT and CBSE Class 10 syllabus? Yes. It is NCERT Chapter 13, Statistics, Section 13.3 “Mode of Grouped Data”, drilled in Exercise 13.2 (6 questions) with Examples 4, 5 and 6. The CBSE scope for the unit reads “Mean, median and mode of grouped data (bimodal situation to be avoided)” — so a question will always have a single modal class, and you will never be asked to handle two equal highest frequencies. Drawing the cumulative frequency graph (ogive) was removed in the rationalisation. Statistics and Probability together carry 11 of the 80 theory marks.
Related Concepts
- Measures of central tendency — how the mode sits alongside mean and median.
- Mean of grouped data — the average and its three methods.
- Median of grouped data — the middle value and cumulative frequency.
- Statistics chapter guide — the whole of Chapter 13 in order.
- Frequency distribution (Class 9) — reading frequencies from a grouped table.
Want to nail every modal-class trap? Practise mixed questions on examfront and use Strength & Weakness Analysis to see whether it’s the modal class or the formula that’s costing you marks.